Enrich your classroom today with dynamic, engaging activities! Create your free teacher account now.
Browse Interactive Math Worksheets
6th Grade
7th Grade
Number System
Expressions & Equations
Ratios & Proportions
Statistics & Probability
Geometry
30 worksheets of 117

Bake And Share: A Budget-friendly Christmas Cake
The activity revolves around the concept of baking a Christmas cake on a tight budget compared to the cost of purchasing one from a store. Students will be guided through ingredient conversions, cost calculations, and the joy of creating a homemade treat.
- Auto-Graded

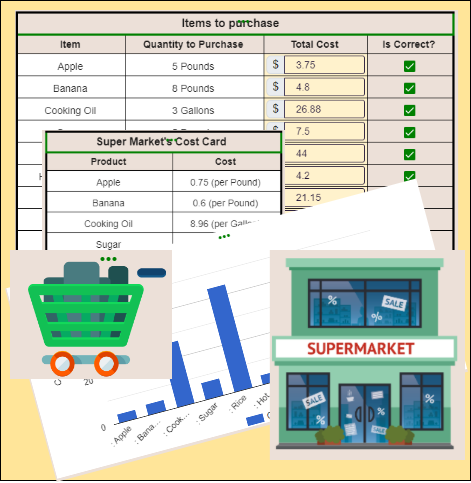
Grandma's Recipe - Unit Conversion & Unit Rate
Students will convert the ingredients of Grandma's cookie from cooking units (eg: cups) to supermarket units (pounds, gallons) and then find the cost.
- Auto-Graded

Cross-country Cost Comparison: Ratio And Fraction
Students act as the CEO of a company, to find the cheapest country to purchase the raw materials, students will do unit conversion between different currencies.

Halloween Races : Speed, Distance & Time
Students will use the speed-distance-time formula to calculate the speed of different Halloween characters.
- Auto-Graded
Fractions: Computing The Total Purchase Cost
The activity will test the knowledge on fractions, multiplication of fractions to solve real world problems.
- Auto-Graded

Statistics: Finding Averages
Analyze the tabular data that shows the attendance in different schools for different weather conditions, and find the average attendances.
- Auto-Graded

Floor Plan - Measuring Room Sizes
Students will analyze the given floor plan and measure the length and width of each room in feet.
- Auto-Graded

Perimeter : Trim Paint Estimation
Students will analyze the floor plan of a house, measure the size of each room, calculate the perimeter of rooms walls to paint the baseboards.
- Auto-Graded

Budgeting For Thanksgiving Feast
Students will calculate the total cost of all ingredients needed for one Thanksgiving meal and then find out the total number of meals that can be prepared in the community kitchen for Thanksgiving Day using the initial $1000 given to them.
- Auto-Graded

Real-world Problems Involving Volume
Students will calculate the volume of various objects, such as a shipping box or fish tank, using given dimensions. Each student will receive a unique set of dimensions, promoting individualized practice and reinforcing their understanding of volume calculations in real-world scenarios.
- Random Questions
- Auto-Graded

Calculate Rates - Real-life Scenarios
Students will calculate rates based on various real-life scenarios. Examples include determining the average speed in miles per hour or the cost per apple. These problems help students apply their understanding of ratios and rates in practical situations, reinforcing their ability to solve real-world problems involving proportional reasoning.
- Random Questions
- Auto-Graded

Using Ratio Tables To Compare Two Scenarios
Students will fill in missing values in two ratio tables based on a given scenario, such as comparing cake prices at a bake sale. After completing the tables, they'll compare the ratios to determine which option is more expensive. This activity enhances their understanding of ratios and comparisons.
- Random Questions
- Auto-Graded

Geometry: Real-world Problems Worksheet
In this geometry worksheet, students will solve 10 real-world problems, determining whether to calculate the circumference or area for tasks like fencing, painting, or tiling. After deciding, they'll perform the calculations and enter their answers. Each student gets unique dimensions for each problem.
- Random Questions
- Auto-Graded

Divide Fractions By Fractions
Students will tackle 15 problems that involve dividing fractions by fractions. Their task is to perform the division and provide the answer in fraction format. Each student will receive a unique set of fractions to work with.
- Random Questions
- Auto-Graded

Greatest Common Factor
Students will find the Greatest Common Factor (GCF) of two numbers in 15 problems. Each problem presents a unique pair of numbers, and students must determine the GCF for each. Each student receives a different set of numbers, promoting independent practice and reinforcing factorization skills.
- Random Questions
- Auto-Graded

Evaluating Expressions
Students will practice substituting given values for variables in various expressions to find the correct answers. They will be provided with 15 questions, each requiring them to substitute the values into the expressions.
- Random Questions
- Auto-Graded

Solving Problems Using Cross-multiplication To Find Unknown Values In Proportional Relationships
Students will practice using cross-multiplication to solve for unknown values in 10 problems. Each student will receive a unique set of numbers, ensuring individualized practice and helping them master the technique of cross-multiplication in solving proportion-related problems.
- Random Questions
- Auto-Graded

Writing Ratios In Different Forms
Students will practice writing ratios in three different forms: as a fraction, using a colon, and using the word "to." They will work through 10 problems, with each student receiving a unique set of numbers. This exercise reinforces the concept of ratios and helps students become proficient in expressing ratios in various formats.
- Random Questions
- Auto-Graded
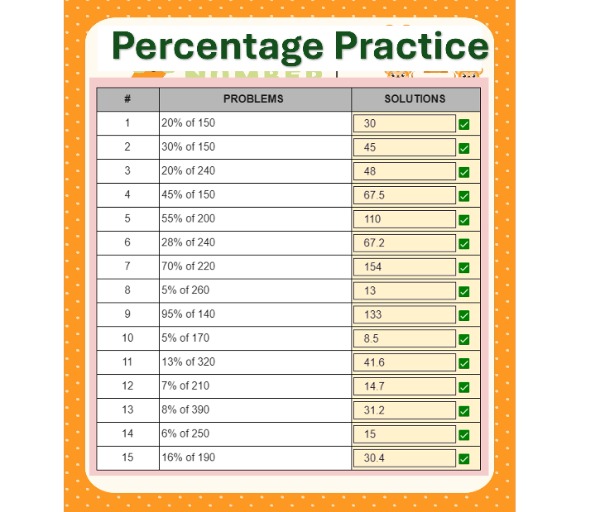
Finding Percentages Of Numbers
Students will solve 15 problems that involve finding the percentage of given numbers, such as calculating 25% of 80. Each student will receive a unique set of questions, providing individualized practice in applying percentage calculations to various numerical values.
- Random Questions
- Auto-Graded

Practicing Ratio Tables
Students will practice completing ratio tables based on given ratios. Each problem presents a ratio along with a partially filled table, and students must use their understanding of ratios to fill in the missing values, reinforcing their skills in working with proportional relationships.
- Random Questions
- Auto-Graded

Real-life Problems Involving Discounts, Sales Tax, And Tips
Students will tackle 12 real-world scenarios where they will apply the concept of percentages to calculate values such as discounts, taxes, and tips. Each student will receive a unique set of problems, encouraging individualized practice and helping them understand the practical applications of percentages in everyday situations.
- Random Questions
- Auto-Graded

Converting Between Fractions, Decimals, And Percentages
Students will work through 15 problems where each row in the table presents a number in one format—either fraction, decimal, or percentage. Their task is to convert the number into the other two formats. Each student will receive a unique set of problems, ensuring individualized practice in mastering these conversions.
- Random Questions
- Auto-Graded

Matching Equivalent Ratios
In this interactive worksheet, students are presented with 16 ratios and must find the equivalent ratio in a table on the right. Using a drag-and-drop feature, they will match each ratio with its equivalent. Each student receives a unique set of ratios.
- Random Questions
- Auto-Graded

Equivalent Ratios: Fill-in-the-blank Tables
Students will practice creating equivalent ratios by filling in the blanks in each table. Based on the given ratio, students will use multiplication or division to find the missing values, reinforcing their understanding of ratio relationships and proportional reasoning.
- Random Questions
- Auto-Graded

Using The Distributive Property
Students will simplify 10 expressions using the distributive property. Each student will receive a unique set of problems, ensuring that the activity is individualized and promotes independent practice in applying the distributive property to algebraic expressions.
- Random Questions
- Auto-Graded
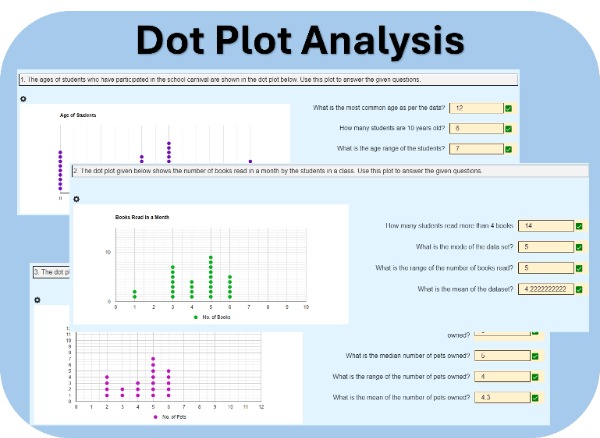
Interpreting Dot Plots
Students will analyze dot plots representing real-world data, such as the ages of students participating in a school carnival. They will answer questions based on these plots. Each student will receive three unique sets of data and questions, encouraging individual analysis and critical thinking.
- Random Questions
- Auto-Graded

Mean, Median, Mode, And Range From Dot Plots
Students will analyze three different dot plots and calculate the mean, median, mode, and range for each plot. Each student will receive a unique set of dot plots, encouraging individual analysis and reinforcing their understanding of these key statistical measures.
- Random Questions
- Auto-Graded

Interpreting Histograms
Students will analyze three different histograms and answer questions based on their observations. Each student will receive a unique set of histograms, promoting individual analysis and understanding of data distribution.
- Random Questions
- Auto-Graded

Creating Frequency Tables From Data Points
Students will create frequency tables from given data sets, with an automatically generated histogram displaying as they enter the values. This interactive activity helps students visualize data and understand the relationship between frequency tables and histograms.
- Random Questions
- Auto-Graded